WireShark
Wireshark is a network packet analyser. A network packet analyser will try to capture network packets and tries to display that packet data as detailed as possible. You could think of a network packet analyser as a measuring device used to examine what’s going on inside a network cable, just like a voltmeter is used by an electrician to examine what’s going on inside an electric cable.
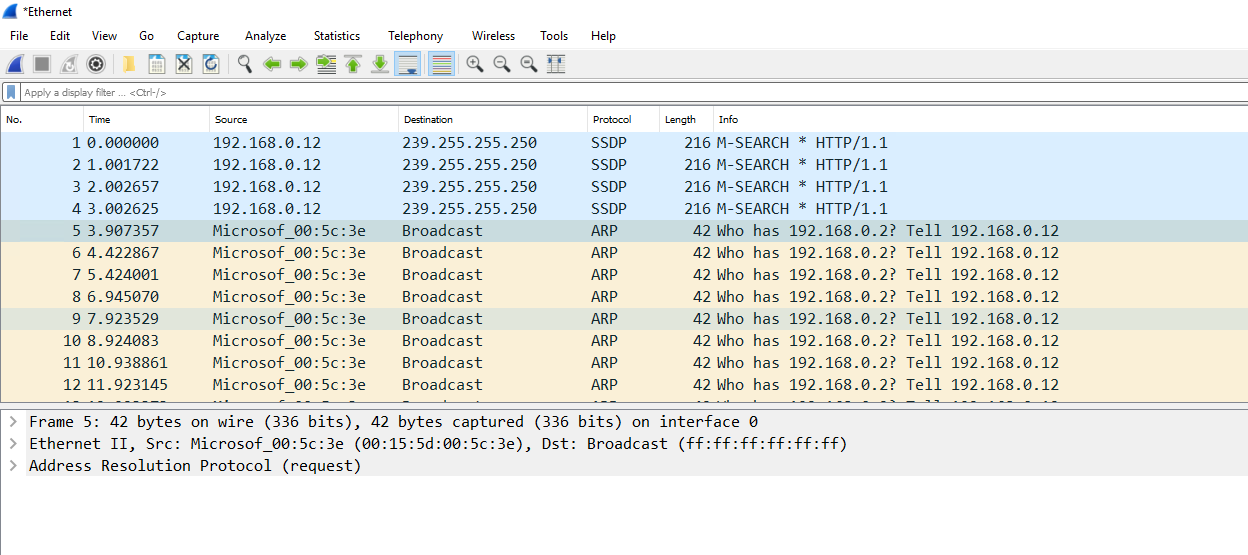
You will now use Wireshark to capture some computer conversations on the broadcast address of your training network. This is a useful exercise to complete if you ever need to perform a capture for fault finding. You can now use Wireshark to see how the DHCP service and APIPA work in the network.
1. Install Wireshark on your client computer. You may wish to install it on the domain controller also but its not important for the exercise.
2. Once installed you will see a similar scree to the one below. It displays all the network interfaces on the computer on which Wireshark is running.
3. Any interface with a trace has network traffic. Depending on the network you may only have one interface but in many cases multiple will be displayed when working in training and virtual network environments.
4. Simply double click the network interface you want to capture, and you will begin to see all the network traffic displayed in the interface.
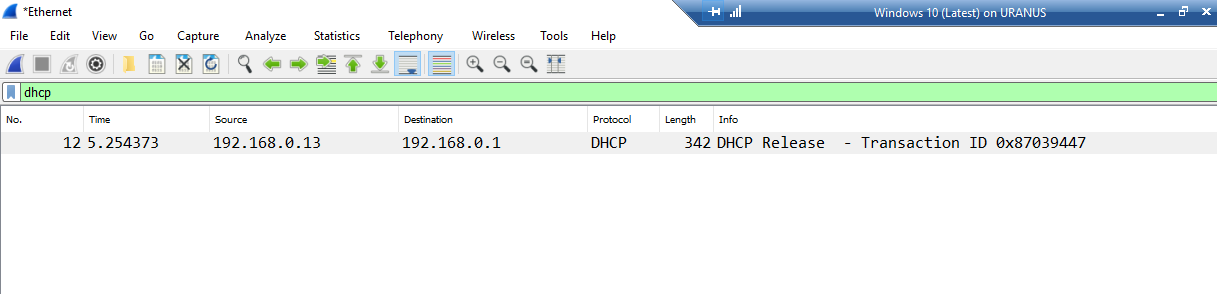
12. Next change your filter to dhcp. You should see the DHCP request to release the IP address.
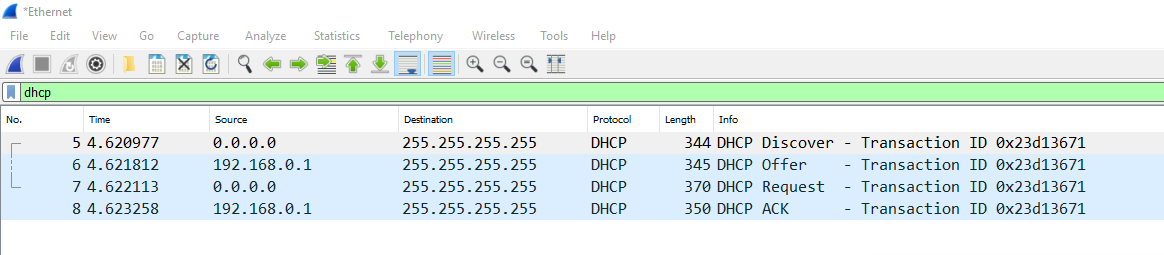
13. Next start a new trace with the Filter set to dhcp and perform the IPCONFIG /RENEW command. This should give you the DHCP request and Acknowledgment.
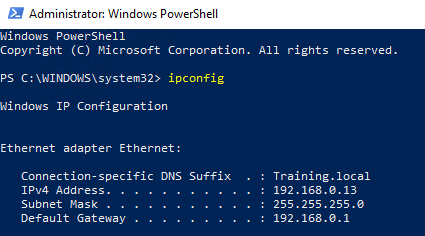
14. You can now see the whole process and the IP Address for the device has been supplied by the DHCP Service.
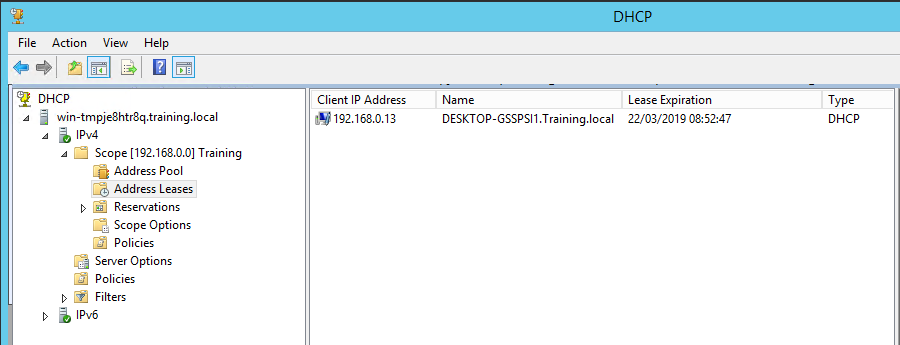
15. Finally, on the DC you will see the allocation from the scope.
16. Close all screens.
Windows Logs and Log Analysis.
Windows Logging Basics
Logs are records of events that happen in your computer, either by a person or by a running process. They help you track what happened and troubleshoot problems.
The Windows event log contains logs from the operating system and applications such as SQL Server or Internet Information Services (IIS). The logs use a structured data format, making them easy to search and analyze. Some applications also write to log files in text format. For example, IIS Access Logs.
This task explores the "Event Viewer" interface and features, and introduces other major application and services logs. Examples are provided to give you a full grasp of how monitoring events can help you fault find your customers systems for both errors and security.
Windows Event Logs
Windows Event Viewer displays the Windows event logs. Use this application to view and navigate the logs, search and filter particular types of logs, export logs for analysis, and more. We’ll show you how to access Windows Event Viewer and demonstrate available features.
Starting Windows Event Viewer
Windows Server Event Viewer can be accessed in several ways:
- Windows Control Panel
- Server Manager
- Windows Admin Center
- Computer Management
- Component Services
- Command Prompt
Windows Control Panel
Control Panel is the standard Windows component for viewing and changing system settings. It can be found in Windows Server and Windows desktop editions. To access the Event Viewer:
1. Switch to AMS-DC1
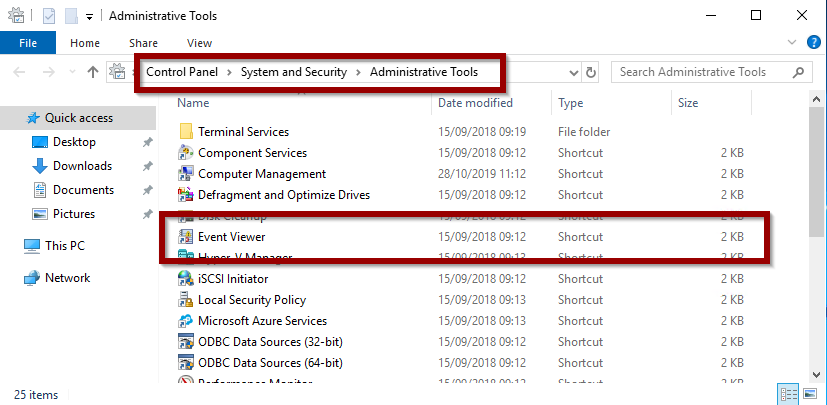
2. Open Control Panel
3. Select Catagory and Show small Icons
4. Click Administrative Tools
5. Click Event Viewer
Server Manager
The Server Manager console lets you manage settings on the local server and on remote servers. To access Event Viewer from Server Manager:
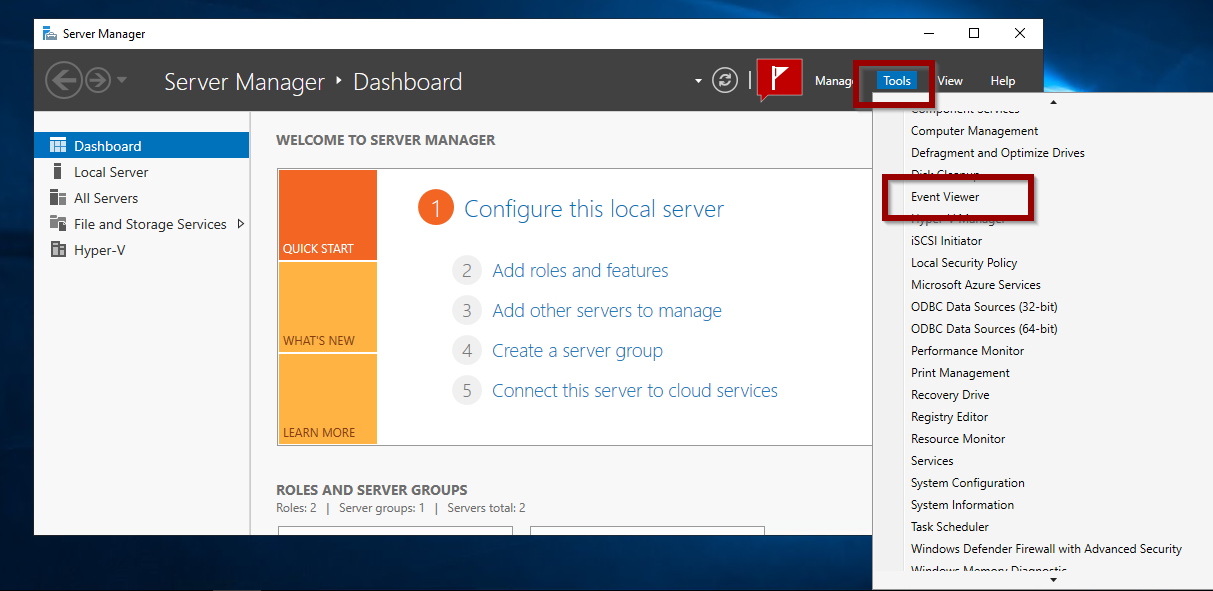
1. Open Server Manager
2. Open Tools > Event Viewer
Windows Admin Center
Windows Admin Center is a browser-based application for managing servers, clusters, desktop PCs, and other infrastructure components. To access Event Viewer from the Windows Admin Center:
1. Open Windows Admin Center in a supported browser.
2. Click Events
Computer Management
The Computer Management console provides access to administrative tasks on a local or remote server. To open Event Viewer from Computer Management:
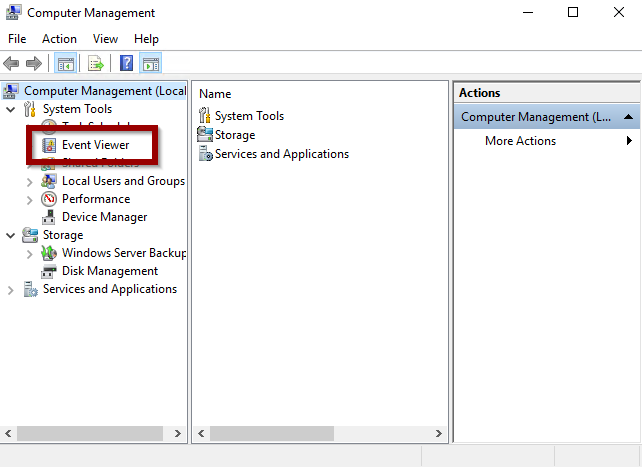
1. Open Computer Management
2. Click Event Viewer
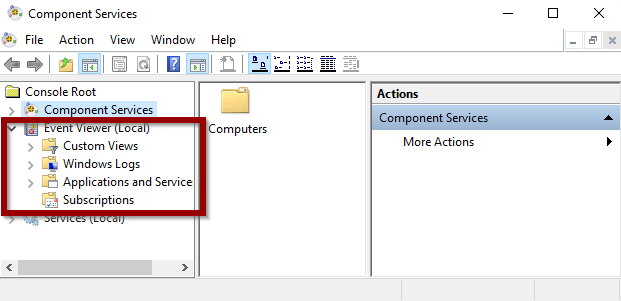
Windows Component Service
Another built-in application is the Windows Component Services Manager that enables us to configure DCOM applications running on Windows. Windows Event Viewer is accessible from Component Services Manager as well:
1. Open Component Services
2. Click Event Viewer
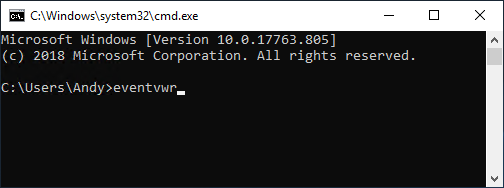
Command Prompt
Lastly, you can open the Event Viewer directly from a command prompt. To do so:
1. Open a Command Prompt
2. Type: eventvwr
Using the Windows Event Viewer Interface
Event Viewer has an intuitive user interface. The main screen is divided into three sections:
- Navigation pane
- Detail pane
- Action pane
You can create Summary and Custom views. This task will guide you through these options.
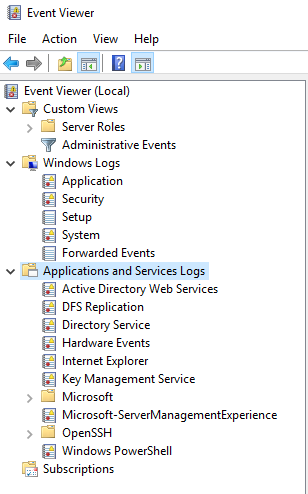
Navigation Pane
The Navigation pane is where you choose the event log to view. By default, there are five categories of Windows logs:
- Application – Information logged by applications hosted on the local machine.
- Security – Information related to login attempts (success and failure), elevated privileges, and other audited events.
- Setup – Messages generated when installing and upgrading the Windows operating system. If the Windows system is a domain controller, those messages are also logged here.
- System – Messages generated by the Windows operating system.
- Forwarded Events – Events forwarded by other computers when the local machine is functioning as a central subscriber.
There is also a section for Applications and Services Logs, including categories for Hardware Events, Internet Explorer and Windows PowerShell events.
- Open the Event Viewer Navigation pane and have a look around.
Detail Pane
When Event Viewer is opened, the Detail pane displays the Overview and Summary.
1. Select an item from the Navigation pane to see a list of events.
Event entries are listed by default in chronological order with the latest events at the top.
2. Click on any column header to sort events by that field in ascending or descending order. Clicking a second time in the same column head reverses the sort order. For example, click on Level to sort by severity. A ^ symbol or reverse indicates the sort field and direction of the sort.
Each event has a severity Level:
| Information messages indicate a successful action. | |
| Warning messages indicate an event occurred that might become a problem. | |
| Error messages indicate a significant problem occurred. | |
| Critical messages indicate a severe problem occurred. | |
| Audit success is associated with security events. | |
| Audit failure is associated with security events. |
Event Viewer Detail pane showing errors and warnings:
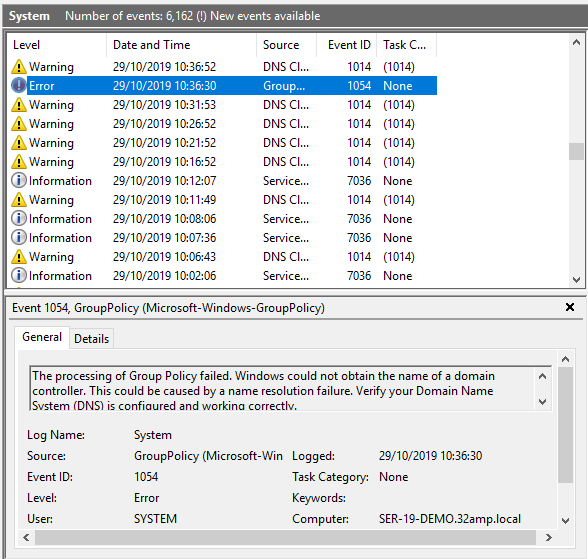
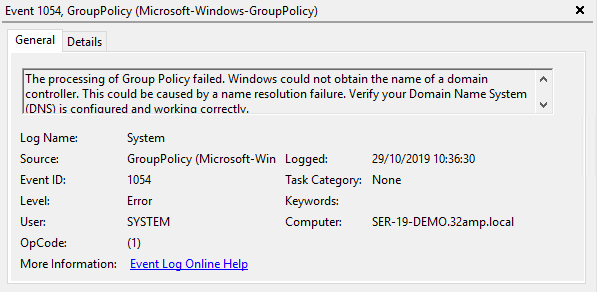
3. Click on an event to display the detailed information. In this example, we can see the highlighted event’s source (Group Policy) and the date and time it occurred. The General tab shows more information: The domain controler cannot be contacted.
Event Viewer Detail pane General tab:
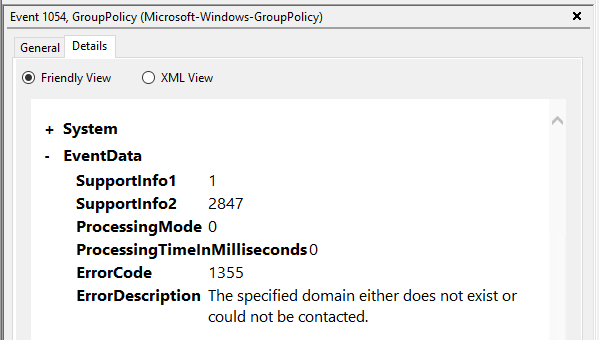
4. Open the Details tab to view the raw event data. You can switch between Friendly View and XML View.
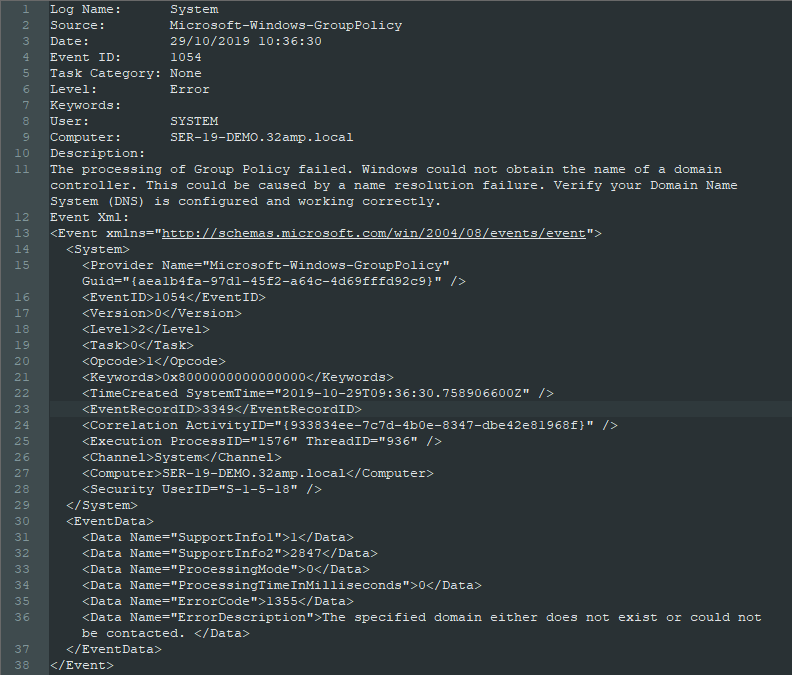
5. You can right-click on an event and select Copy - Copy Details as Text then paste the results into a text editor. The system fields are listed, followed by the entire event as XML.
Actions Pane
The Actions pane provides quick access to actions available for your current selections. The Action pane is divided into two sections:
- Actions available for the selected Navigation pane log
- Actions available for the selected Detail pane event
In this example, we have selected the System log and Event 1014, DNS Client Events:
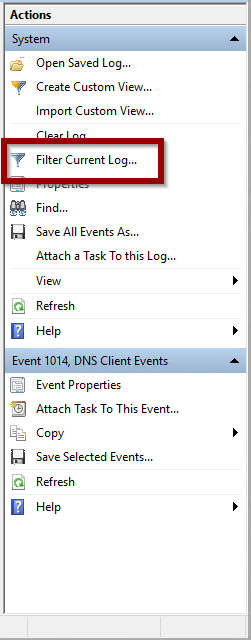
As you can see, there are a number of actions possible when a particular event log is active.
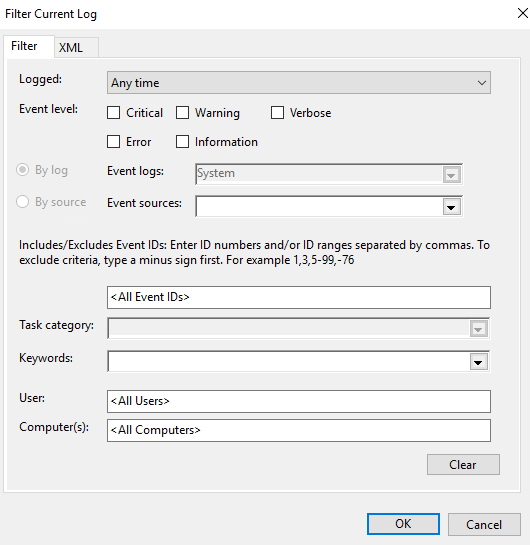
- Click Filter Current Log to search for a particular event or group of events. The pop-up window enables you to specify query criteria.
- When you click OK, your filtered results are shown in the Details pane.
Clearing Large Logs
- You can do some housekeeping on the selected log by right clicking selecting Properties and then with the Clear Log action if it becomes too large. This deletes all events stored in the log.
- To check the size of your log files, select Windows Logs or Applications and Services Logs from the Navigation pane. The Number of Events and Size are shown in the Detail pane.
![]()
Exporting Events
You can click Save All Events As or Save All Events in Custom View As (selected events) or Save All Events As (all events) to export events from the current log to an event file. The event file has an EVTX extension.
Where would you use such functionality? Suppose you want to collect your customers system’s health status to send for further investigation by support - you can provide them with an exported event file. Saving event logs to an event file comes in handy.
- Click on Open Saved Log and navigate to the log location to open the saved log.
Custom Views
Event Viewer enables you to easily create custom views. This provides quick access if you are interested in certain types of event or events based on severity level.
Create a Custom View:
- Select Custom Views in the Navigation pane.
- Click Create Custom View in the Actions pane.
- Select the correct Event Levels to be included.
- Click dropdown to select the Event Log from the list of vailable.
- Click dropdown to select the Event Souces from the list of vailable.
Below is an example of the Aplication log and the print service.
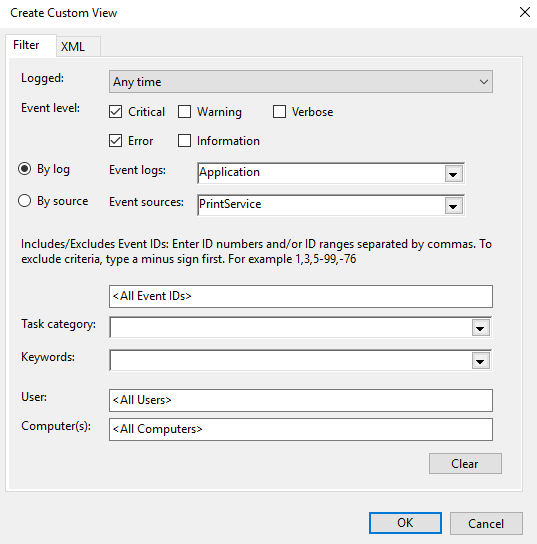
- Click OK
- Enter the Name and Description and select the location for the Custom View.
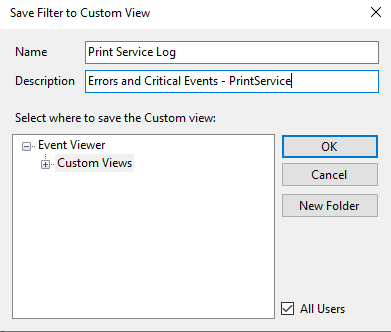
- Click OK
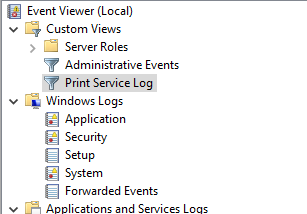
Your Custom View is now available.
Import and Export Custom Views
Similar to saving logs in an event file, you can export an import Custom Views as an XML file. The XML file can be imported into Event Viewer on another system by clicking Import Custom View and navigating to the location of the file.
- Select the Custom View in the Navigation pane.
- Click Export Custom View in the Actions pane.
- Enter a name for the XML file to create for the Custom View.
Summary Views
Event Viewer (Local) is the top node in the Navigation pane. When selected, the Overview and Summary displays in the Details pane.
- Summary of Administration Events displays totals for all Event Types over the course of the week.
- Recently Viewed Nodes displays a history of the viewed nodes in chronological order. Double-click on a node to open the location.
- Log Summary displays the major properties of each log file. Double-click to open the events for the log.
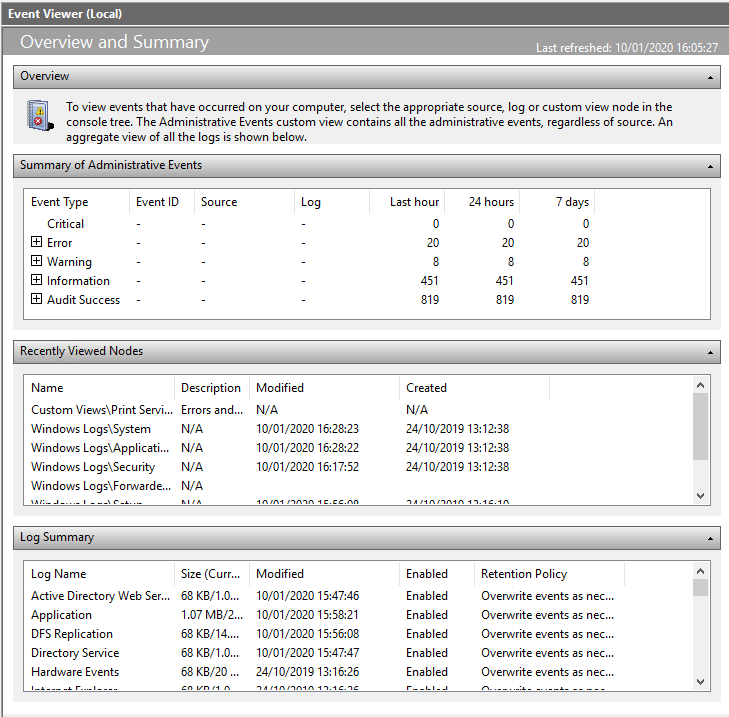
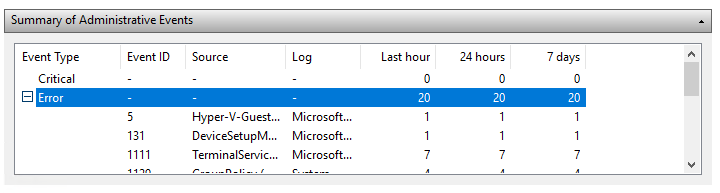
- Looking at the Summary of Events example, there were 20 errors trapped in the last hour, and the number of errors in the last week was also 20.
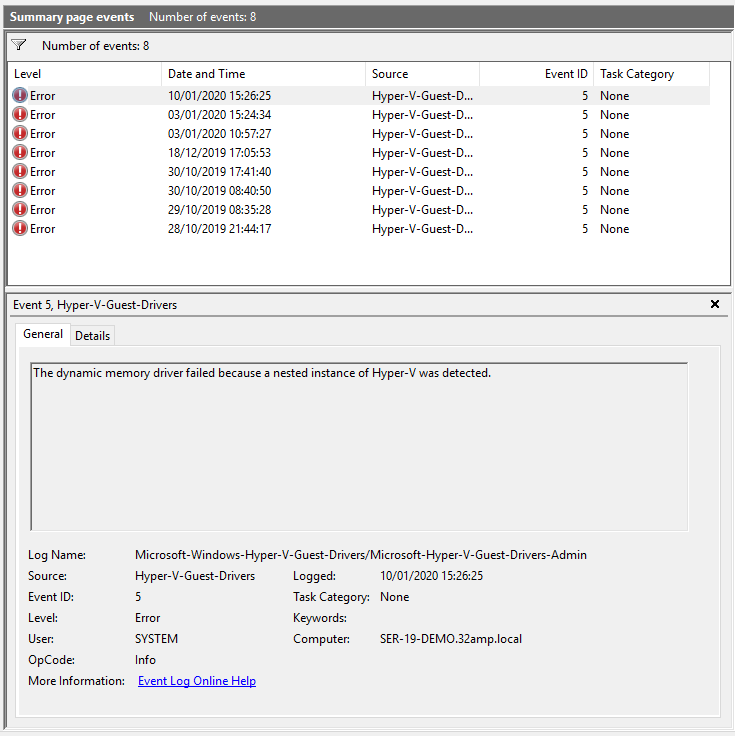
- Click + to expand the Error listing:
- Double-click on an error to open it in the Details pane.
Other Application Logs
There are other logs with their own event viewing mechanisms in Windows:
- IIS Access
- Task Scheduler History
IIS Access Logs
The Internet Information Services access logs include information about requested URIs and status indicating whether the response was successfully served. It writes these logs as files in the W3C Extended Log Format. This format is a type of comma-separated value (CSV).
How to Find IIS Log Files on IIS 7 and Later
- Go to Windows Start and run “inetmgr”. Alternatively, you can go to Administrative Tools → Internet Information Services (IIS) Manager.
- Click on “Sites” in the left-hand tree menu to display a list of sites on the right of the screen. Note your site ID number, which is what IIS saves logs based on.
- Within the tree view or the grid view, double click on your site. Next, double-click the Logging icon for the logging settings screen to open.
- Find your IIS log files in the Directory field of the logging settings screen.
- Go to the IIS log files location in the directory field. Inside this folder, there are subfolders for each site configured with IIS. The naming pattern for the folders the logs are in is W3SVC1, W3SVC2, etc. The number at the end of the folder name corresponds to the site ID mentioned in step No. 2. Thus, W3SVC2 corresponds to site ID 2.
The log file location is specified within the IIS Manager Logging settings. By default, the location is:
%SystemDrive%\inetpub\logs\LogFiles
For example, here’s a log file on C:, with W3SVC1 as the virtual host and u_ex150428 as a file name coded with the date 2015-04-28:
C:\inetpub\logs\LogFiles\W3SVC1u_ex150428.log
Here’s an excerpt from the log file. The column definition is in a comment. The request for /manager/html returned a 404 status code as the page doesn’t exist.
#Software: Microsoft Internet Information Services 7.5
#Version: 1.0    #Date: 2015-04-28 12:12:05
#Fields: date time s-ip cs-method cs-uri-stem cs-uri-query s-port cs-username c-ip
2015-04-28 02:51:38 10.211.14.109 GET /manager/html - 80 - 222.186.56.21 Mozilla/5.0+(compatible;+MSIE+10.0;+Windows+NT+6.2;+WOW64;+Trident/6.0) - 404 0 64 4850
Task Scheduler History Logs
Task Scheduler runs background tasks and applications on a scheduled basis, much like the Linux cron subsystem. An example is a nightly backup script that backs up local SQL Server databases.
Each task has associated history events you can view in the Task Scheduler Detail pane:
